
AxGIS: the imagery engine we built ourselves, and what it does every two hours
Sixteen processing stages, from pulling a satellite pass to the daily archive, run on their own on our servers. This piece explains what AxGIS does, why we wrote it ourselves, and the figures from its operation.
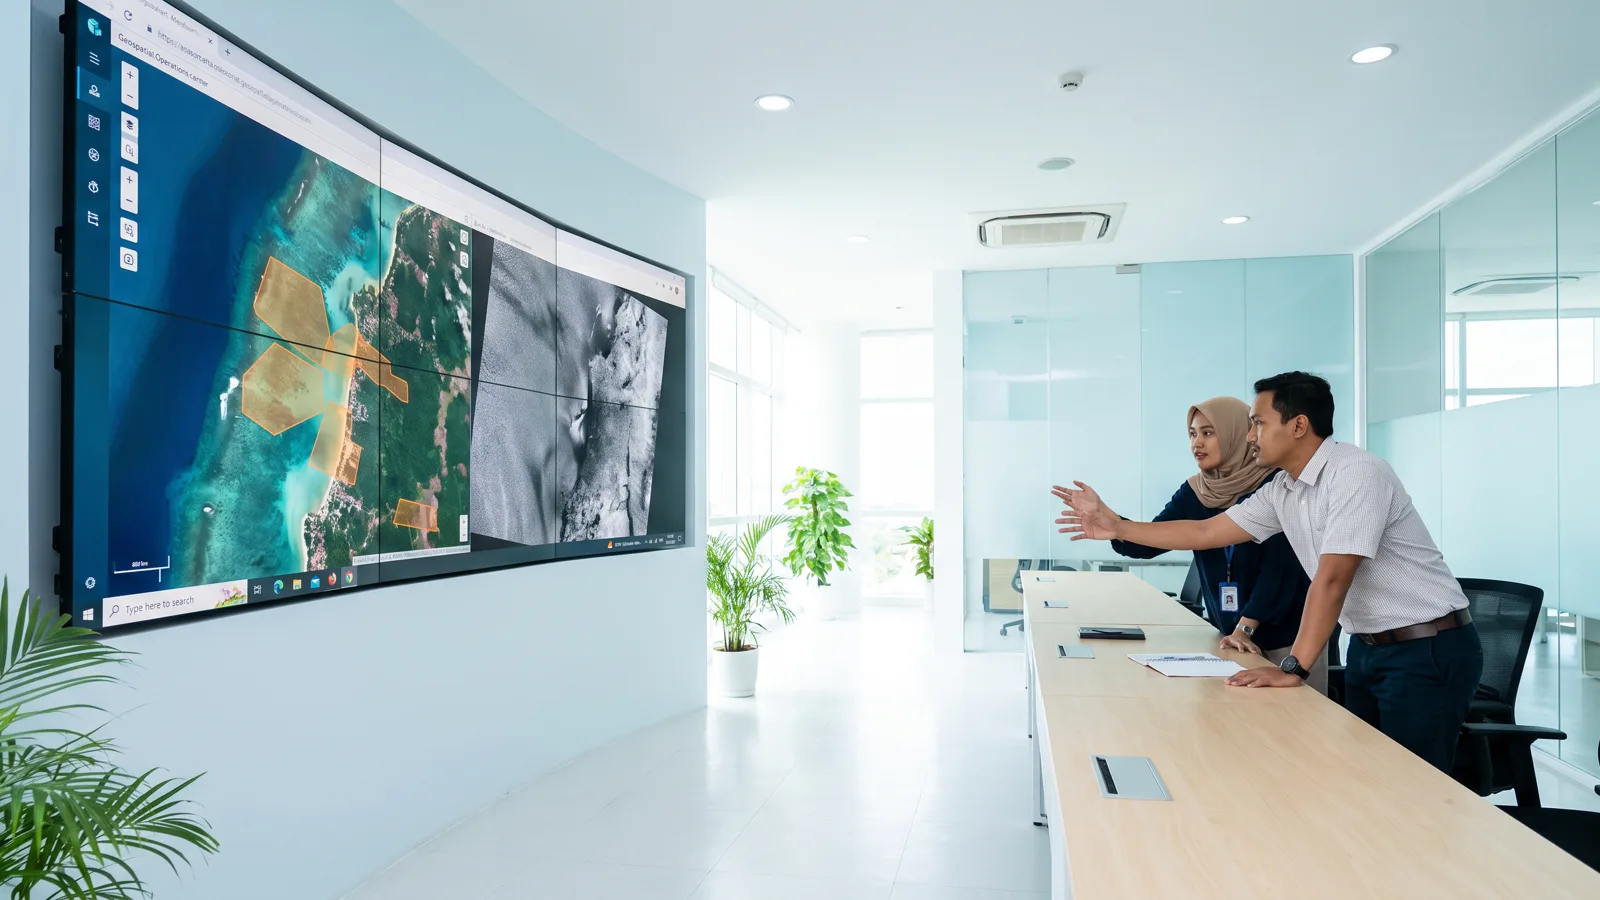
AxGIS is the name we give to the imagery processing chain behind PT Rasi Geo Raya's area monitoring services. It is not one program but sixteen linked stages: reading satellite catalogues, filtering cloud and haze, aligning two passes to a tenth of a pixel, detecting change, confirming it with radar, and keeping every picture ever processed. We fixed version 1.0 on 9 November 2026, after months of daily use over hundreds of mining concession blocks.
Why write it ourselves
There is plenty of good GIS software, and most stages in AxGIS lean on proven open work: the OmniCloudMask cloud mask, SEN2SR and Real-ESRGAN sharpening, radar processing libraries, and others we list in the documentation. What exists nowhere else is the chain: the order of operations that guarantees a new land-clearing alert appears only when two aligned passes agree, the next clear pass confirms, radar concurs, and every pixel can be shown again. We wrote that chain ourselves because we must be able to explain every figure we report, and because our clients do not wait for a monthly report: they want to know within hours.
Sixteen stages, one pass
Every Sentinel-2 pass that reaches the catalogue is read per block window rather than per full scene, so a 200-hectare block does not force us to download a hundred square kilometres. Cloud and shadow are filtered by a machine-learning model, and passes that remain hazy are stopped by a haze gate we calibrated from aerosol values and the blue band: better to wait for the next clear pass than to raise a false alert from peat-fire smoke.
The two passes to be compared are aligned by phase correlation to a tenth of a pixel. Without this step a single-pixel shift is enough to make a road edge read as freshly opened ground. True colour is then computed with one colour engine for every date, so that images across time can be compared by eye.
Change detection uses two indices (bare soil and vegetation) on two aligned passes, confirmation on the next clear pass, and per-pixel evidence on three images before anything becomes an alert. The 0.2-hectare area threshold was chosen after comparing results with field checks. For land blocks, Sentinel-1 then acts as the second judge: a drop in cross-polarised backscatter (VH) on the same patch means vegetation really went, not merely changed colour with the season.
At sea the same chain turns to other work. Bright returns in radar imagery are found with a CFAR test against the surrounding sea, grouped by size and tracked pass to pass. Objects that return at the same position for seven days or more are marked as stationary. From optical imagery we also estimate a vessel's speed from the time lag between sensor bands, a simple trick that uses the way a satellite camera records colours one after another.
What runs on its own
The harvest runs every two hours, not once a night. A pass that reaches the catalogue at eleven in the morning is analysed before lunch. One round over 123 blocks takes about half an hour when there are new passes, and only a few minutes of catalogue queries when there are none.
Since early November 2026 every processed picture is also kept whole: true-colour optical at 10 metres and VV/VH radar in decibels, with the pass, the cloud cover and the engine version that made it. A 45-day backfill over every block produced 2,067 pictures in 75 minutes without a single failure, and the next harvest added 31 new pictures by itself. This archive is the basis of audit: anyone who doubts an alert can open the original picture, not just the resulting map.
The manual work that once made us depend on one person now sits in the administration panel: re-analysing land clearing from a chosen date, refilling radar confirmation, re-detecting vessels, rebuilding stationary objects, producing a picture of a given date at 10 or 2.5 metres, and filling the archive. Each job runs apart from the web server, records its own end, and survives a server restart while we install an update.
What remains outside
We are plain about the limits. We have evaluated the large remote-sensing foundation models but do not yet use them in production, because they need a permanent GPU and more local training data than we have. Automatic boundary segmentation has not replaced official government boundaries. And daily 3-metre imagery is still prepared as a separate package, with a sun-glint correction for turbid shallow water that we calibrated ourselves to a correlation of 0.899 against field data.
AxGIS will keep changing. What will not change are the rules: no finding without evidence, no evidence without the original picture, and no picture thrown away.
How an alert is born
The sequence is always the same, and we deliberately leave no shortcut. At 10.20 Western Indonesian Time the satellite passes. Between four and twenty-seven hours later the pass appears in the official catalogue. On the next harvest round, at most two hours after that, the engine reads every block's window, filters cloud and computes the two indices. If a patch crosses the threshold on this pass and on the previous aligned pass, it joins a waiting list. A new alert is published once the next clear pass repeats the same finding, and by then three images exist as evidence: before, first seen, and confirmation. The officer who opens the alert sees all three side by side with the patch marked, not merely a red dot on a map.
For sea blocks the waiting time is set by radar. A bright return that appears for the first time shows at once as a detected object, but becomes a stationary-object alert only after returning at the same position over several passes for at least seven days. We chose seven days after looking at how long ordinary working vessels lie at anchor; any shorter and the alerts fill with vessels merely calling in.
Measured, not guessed
Every rule above came from measurement, and most of them from our own mistakes. At first our sea alerts relied on optical imagery alone; after requiring radar confirmation with consistent cross-polarised returns and a minimum distance from shore, the precision of sea alerts in internal testing rose from 74 to 93 percent. We lowered the per-pixel evidence threshold for land alerts to 0.1 hectare after re-examining 69 metric-based alerts: 36 of them could not be proven on the imagery, and they no longer enter the official report. The haze gate was born in the smoke season, when passes that looked clear in the catalogue turned out to be covered by thin haze that shifted the vegetation index evenly; we now reject passes whose blue-band value exceeds a threshold we calibrated, and seasonal false alerts fell sharply.
The sun-glint correction for 3-metre imagery was calibrated against turbid shallow-water data from western Indonesia, not with constants from literature written for clear seas; the correlation is 0.899. The dry run of the 3-metre pipeline was exercised on fourteen cases before a single paid picture was bought.
Reports that publish themselves
Every day at 07.00 Western Indonesian Time the daily report is issued from the same data: land-clearing alerts proven per pixel, radar objects at sea, and since November 2026 also the list of AIS-equipped vessels that crossed each sea block, with name, identity number, flag and time. Weekly and monthly reports are built from the same tallies on request. The figures in the report are identical to those on the dashboard because both read from one source; a difference between two documents is the first thing an auditor will question, and we do not want to answer it.
Infrastructure
The whole chain runs on servers we manage in Indonesia. Satellite imagery is taken straight from the official catalogues; processing, storage and presentation pass through no third-party analytics service. Heavy work that needs a GPU, such as 2.5-metre sharpening, runs on a GPU server rented by the hour and switched off when done, so cost follows use. All client data, the imagery archive included, is copied to a second location every night.
Next
Three things are on our desk. First, a daily 3-metre imagery package for a client's entire concession with automatic delivery the day after each pass, whose specification is complete and awaits the provider's quotation. Second, a reader for the now-open L-band radar data from NISAR, as a third judge beneath the vegetation canopy. Third, connectors into clients' internal systems, so that alerts enter their workflow without opening our dashboard. Each will be announced on this page when it runs, not when it is merely planned.